
Effect of a pharmacist intervention on self management practices among hypertensive-diabetic patients receiving care in a Nigerian tertiary hospital

Hypertension specific patient-reported outcome measure. Part II: validation survey and item selection process
Abstract in English:
Hypertension specific patient-reported outcome measure. Part II: validation survey and item selection process. Russian Journal of Cardiology. 2019;(7):40-46
https://doi.org/10.15829/1560-4071-2019-7-40-46
English full-text:
https://russjcardiol.elpub.ru/jour/article/view/3682/2720
Collection of selected articles 2019. Russian Journal of Cardiology. 2019;(12s3):46-68. https://doi.org/10.15829/1560-4071-2019-s3
The present work is the second and the key step in the development of hypertension-specific patient-reported outcome measure (HYpertension imPact quEstionnaire, HYPE), which is the most labor-intensive, but at the same time, however, extremely exciting.
We carried out a large-scale survey with HYPE test version, distributed to more than 400 respondents (50 healthy volunteers and 360 patients with uncontrolled essential hypertension), whose answers have formed the basis for the interim HYPE version, cut in half (163 to 80 items), after several stages of psychometric, statistical and expert analyses implemented.
This «item-selection» step was carried out based on the principles and criteria of the classical test theory (CTT) and the item response theory (IRT). These are two currently popular statistical frameworks for patient-reported outcomes development, test-score equating, and the identification of biased test items. In the case with CTT, six different criteria were applied to each question in the HYPE test version. In addition to purely mathematical ones, the Cronbach’s α coefficient (a measure of reliability) was adopted.
In the IRT analysis, item parameters of discrimination (coefficient a) and difficulty (classically, four degrees) were estimated with maximum likelihood estimation. Moreover, item characteristic curves (ICC) were used to graphically show item’s informativeness.
What is an ICC? In each item, five curves represent five options. Ideally, while the first (corresponds to the possible answer according to Likert scale) curve is steadily decreasing, then the last curve is steadily increasing and the middle three curves follow the normal distribution. The closer the ICC of an item is to the ideal case, the more information it contains.
This step in development of the hypertension-specific questionnaire (HYPE) served as a key one. The results obtained led to its twofold reduction due to the exclusion of inappropriate items and has paved the way for the next step which contained validity, reliability and sensitivity analyses. Furthermore, the primary structure and conceptual framework have been remained mostly unchanged. The take-home message from the article reminds an old saying «He that would eat the fruit must climb the tree».


The ISH is positively committed to opposing discrimination against people on the grounds of gender, race, colour, nationality, religion, marital status, sexual orientation, class, age, disability, having dependants, HIV status or perceived lifestyle.
Follow us @ISHBP to keep up to date with the latest offers and news
📢Don't miss out on the #ISH2024 Congress in #Cartagena!
Find your perfect stay with us and enjoy:
✅Best Rates
✅Negotiated Booking Conditions
✅On-site Assistance
✅Safe & Comfy Stays
Book your accommodation today before places run out! https://ish2024.org/accommodation/
Learn more about the @ESHypertension MASTERplan for hypertension management.
Join us this week – registration attached
https://servier.live.medicalcongress.online/.
@KreutzReinhold @ISHBP @ERAkidney @escardio @EFIM_EU @EuGMSSociety
Don't miss the ISH Congress Soirée!
Hypertension, music, and an incredible atmosphere in #Cartagena
September 21st ⏰ 7:30 PM Terraza del Claustro de las Ánimas (CCCI)
Limited seats! Reserve now: https://barcelo.eventsair.com/ish-2024/formulario-de-inscripcion-eng
#ish2024 #congresssoirée
Listen to this excellent podcast with Profs. @alta_schutte, @FZMarques, Bruce Neal, George Stergiou and James Sharman on novel lifestyle approaches to lowering #bloodpressure and the proper measurement of #hypertension ⬇️
 https://ish-world.com/wp-content/uploads/2024/07/ISH2024-Programme-Screenshot.png
1623
2871
Helen Horsfield
http://ish-world.com/wp-content/uploads/2021/01/ISH-Logo-full-name-1000x354.jpg
Helen Horsfield2024-07-15 08:48:112024-07-15 10:51:02ISH Officers part of Malaysian Society of Hypertension meeting
https://ish-world.com/wp-content/uploads/2024/07/ISH2024-Programme-Screenshot.png
1623
2871
Helen Horsfield
http://ish-world.com/wp-content/uploads/2021/01/ISH-Logo-full-name-1000x354.jpg
Helen Horsfield2024-07-09 17:27:382024-07-09 17:41:35View the ISH2024 Meeting Programme
https://ish-world.com/wp-content/uploads/2024/07/ISH2024-Programme-Screenshot.png
1623
2871
Helen Horsfield
http://ish-world.com/wp-content/uploads/2021/01/ISH-Logo-full-name-1000x354.jpg
Helen Horsfield2024-07-15 08:48:112024-07-15 10:51:02ISH Officers part of Malaysian Society of Hypertension meeting
https://ish-world.com/wp-content/uploads/2024/07/ISH2024-Programme-Screenshot.png
1623
2871
Helen Horsfield
http://ish-world.com/wp-content/uploads/2021/01/ISH-Logo-full-name-1000x354.jpg
Helen Horsfield2024-07-09 17:27:382024-07-09 17:41:35View the ISH2024 Meeting Programme https://ish-world.com/wp-content/uploads/2024/06/George-Bakris.jpg
683
1024
Helen Horsfield
http://ish-world.com/wp-content/uploads/2021/01/ISH-Logo-full-name-1000x354.jpg
Helen Horsfield2024-06-18 16:16:122024-06-24 10:41:09Obituary – Professor George Bakris
https://ish-world.com/wp-content/uploads/2024/06/George-Bakris.jpg
683
1024
Helen Horsfield
http://ish-world.com/wp-content/uploads/2021/01/ISH-Logo-full-name-1000x354.jpg
Helen Horsfield2024-06-18 16:16:122024-06-24 10:41:09Obituary – Professor George Bakris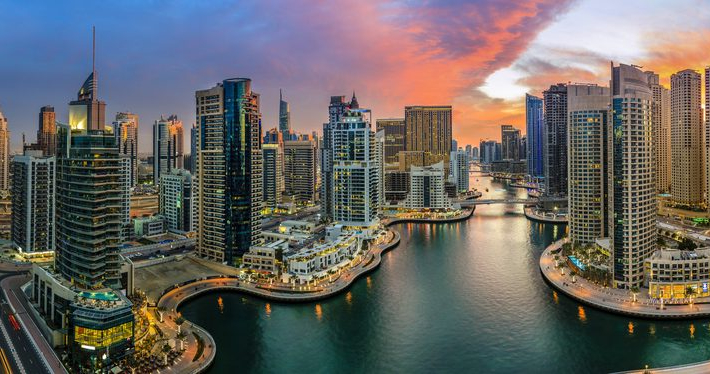 https://ish-world.com/wp-content/uploads/2024/05/Dubai-May-2024-e-Bulletin-image.jpeg
374
1128
Helen Horsfield
http://ish-world.com/wp-content/uploads/2021/01/ISH-Logo-full-name-1000x354.jpg
Helen Horsfield2024-05-22 11:36:282024-05-22 20:49:08Venue for ISH 2026 Scientific Meeting announced
https://ish-world.com/wp-content/uploads/2024/05/Dubai-May-2024-e-Bulletin-image.jpeg
374
1128
Helen Horsfield
http://ish-world.com/wp-content/uploads/2021/01/ISH-Logo-full-name-1000x354.jpg
Helen Horsfield2024-05-22 11:36:282024-05-22 20:49:08Venue for ISH 2026 Scientific Meeting announced https://ish-world.com/wp-content/uploads/2024/04/Join-the-ISH-for-free-website-graphic.jpg
405
720
Helen Horsfield
http://ish-world.com/wp-content/uploads/2021/01/ISH-Logo-full-name-1000x354.jpg
Helen Horsfield2024-04-09 23:00:402024-04-10 10:42:46Join the ISH for free
https://ish-world.com/wp-content/uploads/2024/04/Join-the-ISH-for-free-website-graphic.jpg
405
720
Helen Horsfield
http://ish-world.com/wp-content/uploads/2021/01/ISH-Logo-full-name-1000x354.jpg
Helen Horsfield2024-04-09 23:00:402024-04-10 10:42:46Join the ISH for free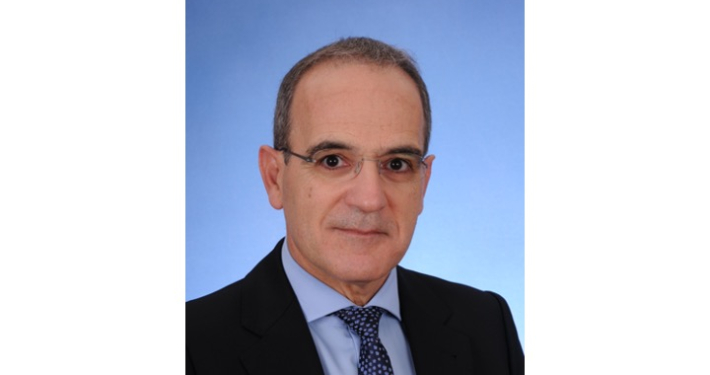 http://ish-world.com/wp-content/uploads/2021/01/ISH-Logo-full-name-1000x354.jpg
0
0
Helen Horsfield
http://ish-world.com/wp-content/uploads/2021/01/ISH-Logo-full-name-1000x354.jpg
Helen Horsfield2024-04-09 22:44:042024-04-30 10:32:20ISH Lifestyle Position Paper: New directions in management of high blood pressure
https://ish-world.com/wp-content/uploads/2024/03/George-pic-for-website-homepage.jpg
405
720
ISH Secretariat
http://ish-world.com/wp-content/uploads/2021/01/ISH-Logo-full-name-1000x354.jpg
ISH Secretariat2024-03-21 21:37:172024-03-22 08:42:15Professor George Stergiou confirmed as President Elect of the ISH
http://ish-world.com/wp-content/uploads/2021/01/ISH-Logo-full-name-1000x354.jpg
0
0
Helen Horsfield
http://ish-world.com/wp-content/uploads/2021/01/ISH-Logo-full-name-1000x354.jpg
Helen Horsfield2024-04-09 22:44:042024-04-30 10:32:20ISH Lifestyle Position Paper: New directions in management of high blood pressure
https://ish-world.com/wp-content/uploads/2024/03/George-pic-for-website-homepage.jpg
405
720
ISH Secretariat
http://ish-world.com/wp-content/uploads/2021/01/ISH-Logo-full-name-1000x354.jpg
ISH Secretariat2024-03-21 21:37:172024-03-22 08:42:15Professor George Stergiou confirmed as President Elect of the ISH
© 2023 International Society of Hypertension. All rights reserved. | Terms & Conditions | Privacy | Home | created by eb-webdesign.com


