


The ISH is positively committed to opposing discrimination against people on the grounds of gender, race, colour, nationality, religion, marital status, sexual orientation, class, age, disability, having dependants, HIV status or perceived lifestyle.
Our latest tweets
Follow us @ISHBP to keep up to date with the latest offers and news
📢Don't miss out on the #ISH2024 Congress in #Cartagena!
Find your perfect stay with us and enjoy:
✅Best Rates
✅Negotiated Booking Conditions
✅On-site Assistance
✅Safe & Comfy Stays
Book your accommodation today before places run out! https://ish2024.org/accommodation/
Twitter feed video.
Learn more about the @ESHypertension MASTERplan for hypertension management.
Join us this week – registration attached
https://servier.live.medicalcongress.online/.
@KreutzReinhold @ISHBP @ERAkidney @escardio @EFIM_EU @EuGMSSociety

Don't miss the ISH Congress Soirée!
Hypertension, music, and an incredible atmosphere in #Cartagena
September 21st ⏰ 7:30 PM Terraza del Claustro de las Ánimas (CCCI)
Limited seats! Reserve now: https://barcelo.eventsair.com/ish-2024/formulario-de-inscripcion-eng
#ish2024 #congresssoirée
Twitter feed video.
Listen to this excellent podcast with Profs. @alta_schutte, @FZMarques, Bruce Neal, George Stergiou and James Sharman on novel lifestyle approaches to lowering #bloodpressure and the proper measurement of #hypertension ⬇️
 https://ish-world.com/wp-content/uploads/2024/07/ISH2024-Programme-Screenshot.png
1623
2871
Helen Horsfield
http://ish-world.com/wp-content/uploads/2021/01/ISH-Logo-full-name-1000x354.jpg
Helen Horsfield2024-07-15 08:48:112024-07-15 10:51:02ISH Officers part of Malaysian Society of Hypertension meeting
https://ish-world.com/wp-content/uploads/2024/07/ISH2024-Programme-Screenshot.png
1623
2871
Helen Horsfield
http://ish-world.com/wp-content/uploads/2021/01/ISH-Logo-full-name-1000x354.jpg
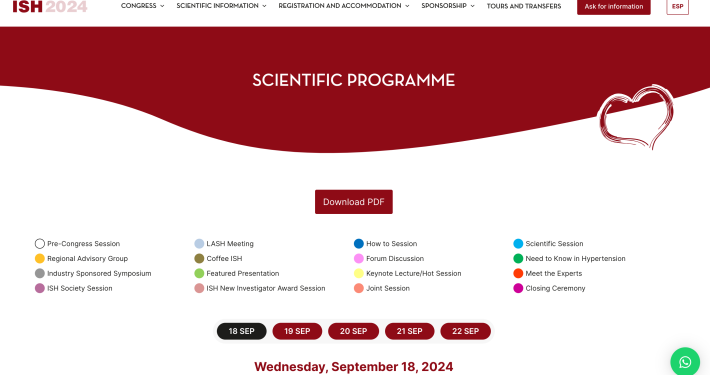
Helen Horsfield2024-07-09 17:27:382024-07-09 17:41:35View the ISH2024 Meeting Programme
https://ish-world.com/wp-content/uploads/2024/07/ISH2024-Programme-Screenshot.png
1623
2871
Helen Horsfield
http://ish-world.com/wp-content/uploads/2021/01/ISH-Logo-full-name-1000x354.jpg
Helen Horsfield2024-07-15 08:48:112024-07-15 10:51:02ISH Officers part of Malaysian Society of Hypertension meeting
https://ish-world.com/wp-content/uploads/2024/07/ISH2024-Programme-Screenshot.png
1623
2871
Helen Horsfield
http://ish-world.com/wp-content/uploads/2021/01/ISH-Logo-full-name-1000x354.jpg
Helen Horsfield2024-07-09 17:27:382024-07-09 17:41:35View the ISH2024 Meeting Programme https://ish-world.com/wp-content/uploads/2024/06/George-Bakris.jpg
683
1024
Helen Horsfield
http://ish-world.com/wp-content/uploads/2021/01/ISH-Logo-full-name-1000x354.jpg
Helen Horsfield2024-06-18 16:16:122024-06-24 10:41:09Obituary – Professor George Bakris
https://ish-world.com/wp-content/uploads/2024/06/George-Bakris.jpg
683
1024
Helen Horsfield
http://ish-world.com/wp-content/uploads/2021/01/ISH-Logo-full-name-1000x354.jpg
Helen Horsfield2024-06-18 16:16:122024-06-24 10:41:09Obituary – Professor George Bakris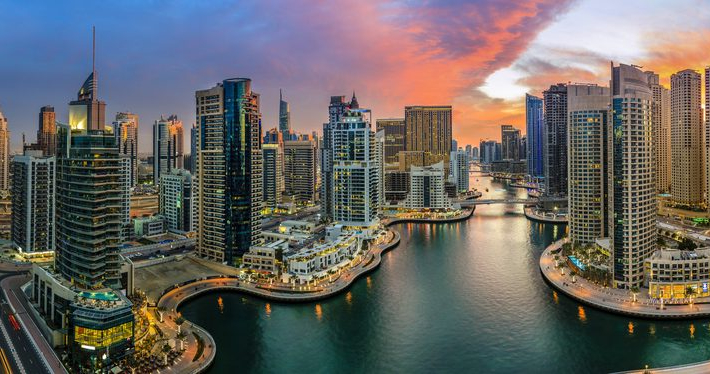 https://ish-world.com/wp-content/uploads/2024/05/Dubai-May-2024-e-Bulletin-image.jpeg
374
1128
Helen Horsfield
http://ish-world.com/wp-content/uploads/2021/01/ISH-Logo-full-name-1000x354.jpg
Helen Horsfield2024-05-22 11:36:282024-05-22 20:49:08Venue for ISH 2026 Scientific Meeting announced
https://ish-world.com/wp-content/uploads/2024/05/Dubai-May-2024-e-Bulletin-image.jpeg
374
1128
Helen Horsfield
http://ish-world.com/wp-content/uploads/2021/01/ISH-Logo-full-name-1000x354.jpg
Helen Horsfield2024-05-22 11:36:282024-05-22 20:49:08Venue for ISH 2026 Scientific Meeting announced https://ish-world.com/wp-content/uploads/2024/04/Join-the-ISH-for-free-website-graphic.jpg
405
720
Helen Horsfield
http://ish-world.com/wp-content/uploads/2021/01/ISH-Logo-full-name-1000x354.jpg
Helen Horsfield2024-04-09 23:00:402024-04-10 10:42:46Join the ISH for free
https://ish-world.com/wp-content/uploads/2024/04/Join-the-ISH-for-free-website-graphic.jpg
405
720
Helen Horsfield
http://ish-world.com/wp-content/uploads/2021/01/ISH-Logo-full-name-1000x354.jpg
Helen Horsfield2024-04-09 23:00:402024-04-10 10:42:46Join the ISH for free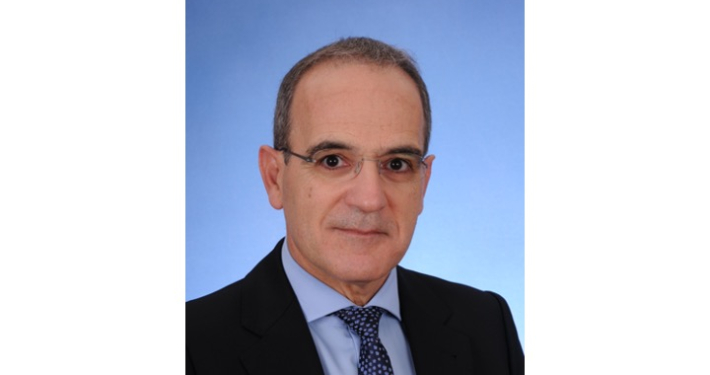 http://ish-world.com/wp-content/uploads/2021/01/ISH-Logo-full-name-1000x354.jpg
0
0
Helen Horsfield
http://ish-world.com/wp-content/uploads/2021/01/ISH-Logo-full-name-1000x354.jpg
Helen Horsfield2024-04-09 22:44:042024-04-30 10:32:20ISH Lifestyle Position Paper: New directions in management of high blood pressure
https://ish-world.com/wp-content/uploads/2024/03/George-pic-for-website-homepage.jpg
405
720
ISH Secretariat
http://ish-world.com/wp-content/uploads/2021/01/ISH-Logo-full-name-1000x354.jpg
ISH Secretariat2024-03-21 21:37:172024-03-22 08:42:15Professor George Stergiou confirmed as President Elect of the ISH
http://ish-world.com/wp-content/uploads/2021/01/ISH-Logo-full-name-1000x354.jpg
0
0
Helen Horsfield
http://ish-world.com/wp-content/uploads/2021/01/ISH-Logo-full-name-1000x354.jpg
Helen Horsfield2024-04-09 22:44:042024-04-30 10:32:20ISH Lifestyle Position Paper: New directions in management of high blood pressure
https://ish-world.com/wp-content/uploads/2024/03/George-pic-for-website-homepage.jpg
405
720
ISH Secretariat
http://ish-world.com/wp-content/uploads/2021/01/ISH-Logo-full-name-1000x354.jpg
ISH Secretariat2024-03-21 21:37:172024-03-22 08:42:15Professor George Stergiou confirmed as President Elect of the ISH


© 2023 International Society of Hypertension. All rights reserved. | Terms & Conditions | Privacy | Home | created by eb-webdesign.com